
EDX
Phase mapping method using EDX hyperspectral data
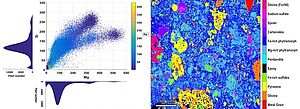
The development of FEG electron microscopes such as the JEOL JSM-7800F LV, the exponential growth of collected data and the emergence of free softwares such as Hyperspy allow us to quantify many characteristics of heterogeneous assemblages at the micrometer scale. It is precisely at this scale that primitive meteorites display a high degree of heterogeneity in terms of composition, density and grain size, limiting their analysis by conventional methods. To better constrain the nature of these fine-grained materials, a new method coupling phase mapping in low-voltage (6 KeV) SEM-EDS conditions and quantification by electron microprobe has been developed within the electron microscopy center. The objective is to simultaneously quantify the composition and abundance of the submicron phases, to determine the geometry and density of the grains, and to obtain the overall composition of the analyzed zone. This new method is called ACADEMY for: Analyzing the Composition, the modal Abundance and the Density using Electron MicroscopY.
Pierre-Marie Zanetta (MTP-UMET), Corentin le Guillou (MTP-UMET), Hugues Leroux (MTP-UMET)
Quantification of light elements by Energy dispersive X-ray spectroscopy (EDS)
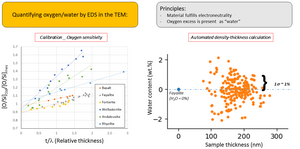
Being able to quantify light elements concentration by transmission electron microscopy is of the highest importance for a wide range of industrial and natural materials. For instance, it can be crucial to determine the oxygen content of a glass or a polymer. The new generation of EDX detectors (SDD, windowless; as installed on the Titan Themis) have a much higher sensitivity to light elements and now allows reproducible and precise measurements. Thus, the limitation is no longer the detector itself, but the ability to determine the density and thickness of the sample and to perform accurate absorption correction. This project focuses on the calibration of the detector for several light elements (carbon, oxygen), as well as to the development of an original methodology to perform automated absorption correction (based on a dedicated HyperSpy routine). In the figure on the left one can see oxygen k-factor calibration based on a series of silicates standards. The reproducibility of the k-factor value (extrapolation of the curve at thickness=0) is better than 5%. On the right: Based on the oxygen measurement and the absorption correction map (calculated thanks to a HyperSpy routine), we are able to determine the water content. Each point represents the pixel to pixel variability of a hyperspectral map.
Corentin Le Guillou (MTP-UMET), Hugues Leroux (MTP-UMET), Pierre-Marie Zanetta (MTP-UMET), Maya Marinova (PMEL)